The relationship between mean, median, and mode depends on the distribution of the data and it's very important to understand in statistics and is useful while dealing with similar problems. In the case of a moderately skewed distribution, i.e. in general, the difference between mean and mode is equal to three times the difference between the mean and median. i.e., (Mean - Mode) = 3 (Mean - Median). This can be rearranged as 3 Median = 2 Mean + Mode and this is easy to remember.
We can also compare the mean, median and mode by looking at the frequency distribution curve of the data. There are commonly three types of distribution:
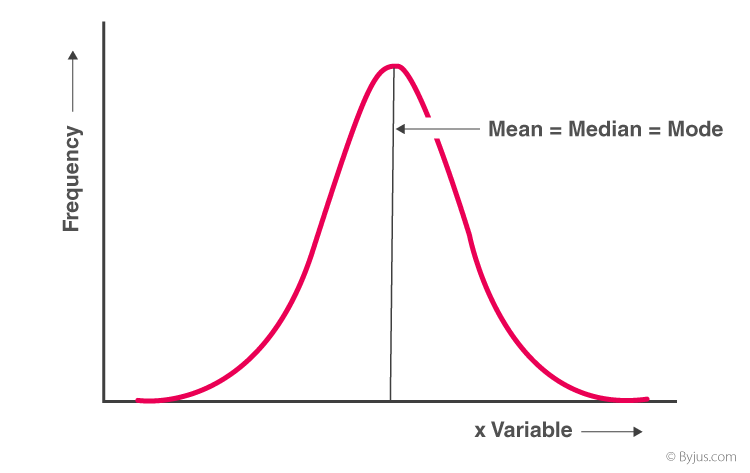
Symmetrical Frequency Distribution
In a symmetrical frequency distribution, values are equally distributed on both sides of the central point, creating a balanced and mirror-like pattern in the histogram or frequency polygon.
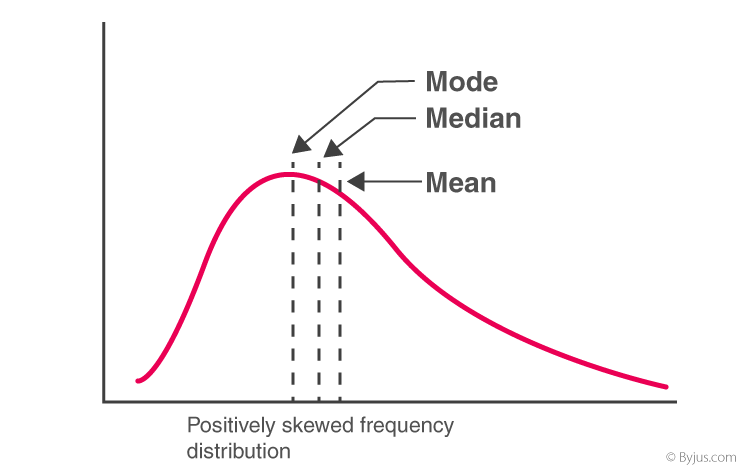
Positively Skewed Frequency Distribution
A positively skewed frequency distribution is characterized by a longer right tail. The majority of values cluster on the left side, while a few higher values extend the distribution to the right.
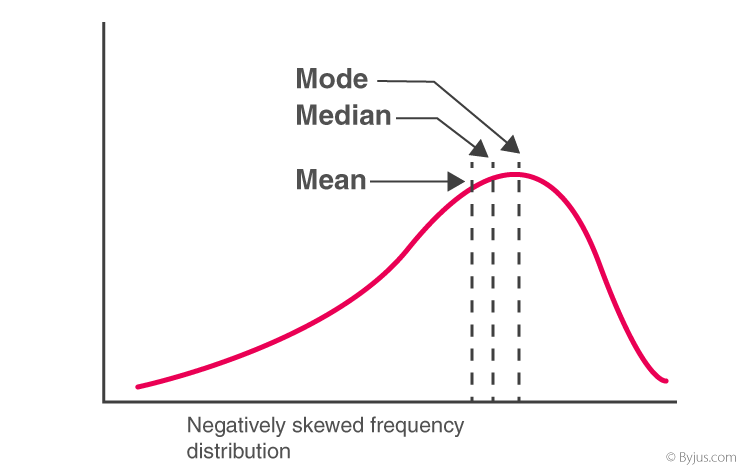
Negatively Skewed Frequency Distribution
In a negatively skewed frequency distribution, or left-skewed, the bulk of values cluster on the right side, and a longer left tail is observed. This indicates that there are fewer lower values, and the distribution is pulled toward the left. Relationship between A.M, G.M, H.M will remain same. A.M >G.M>H.M
Relation Between Mean Median and Mode Formula
Before learning about the relation between mean, median, and mode formula, let us revise the concepts of mean, median, and mode.
The arithmetic mean refers to the average of a data set of numbers. It can either be a simple average or a weighted average. To calculate a simple average, we add up all the numbers given in the data set and then divide it by the total frequency.
The median is the middle number of a given data set when it is arranged in either a descending order or ascending order. If there is an odd amount of numbers, the median value is the number that is in the middle whereas if there is an even amount of numbers, the median is the simple average of the middle pair in the dataset. Median is much more effective than a mean because it eliminates the outliers.
The mode refers to the number that appears the most in a dataset. A set of numbers may have one mode, or more than one mode, or no mode at all.
The formula to define the relation between mean, median, and mode in a moderately skewed distribution is 3 (median) = mode + 2 mean. The proof of the mean, median, mode formula can be understood using Karl Pearson’s formula, which states:
(Mean - Median) = 1/3 (Mean - Mode)
3 (Mean - Median) = (Mean - Mode)
3 Mean - 3 Median = Mean - Mode
3 Median = 3 Mean - Mean + Mode
3 Median = 2 Mean + Mode
- Mean is the average of the data set which is calculated by adding all the data values together and dividing it by the total number of data sets.
- Median is the middle value among the observed set of values and is calculated by arranging the values in ascending order or in descending order and then choosing the middle value.
- Mode is the number from a data set which has the highest frequency and is calculated by counting the number of times each data value occurs.
Mean Median Mode Relation With Frequency Distribution
- Frequency Distribution with Symmetrical Frequency Curve
If a frequency distribution graph has a symmetrical frequency curve, then mean, median and mode will be equal.
- For Positively Skewed Frequency Distribution
In case of a positively skewed frequency distribution, the mean is always greater than median and the median is always greater than the mode.
Empirical Relationship between Mean, Median and Mode
In case of a moderately skewed distribution, the difference between mean and mode is almost equal to three times the difference between the mean and median. Thus, the empirical mean median mode relation is given as:
| Mean – Mode = 3 (Mean – Median) |
Or
- For Negatively Skewed Frequency Distribution
In case of a negatively skewed frequency distribution, the mean is always lesser than median and the median is always lesser than the mode.
Example 1: The median and mode for a given set of data points is 20 and 30 respectively. Find out the mean. (Assume a moderately skewed distribution)
Solution:
Given,
Mode = 30, Median = 20
To find the Mean:
Mode = 3×Median − 2×Mean
30=3×20−2×Mean
30=60−2×Mean
2×Mean=30
Mean=15
Example 2: The mean and mode for a given set of data points is 20 and 30 respectively. Find out the mean. (Assume a moderately skewed distribution)
Solution:
Given:
Mode = 25, Mean = 12
To find the Median:
Mode=3×Median−2×Mean
25=3×Median−2×12
25=3×Median−24
3×Median=49
Median≈16.33
Example 3: The median and mean for a given set of data points is 15 and 10 respectively. Find out the mean. (Assume a moderately skewed distribution)
Solution:
Given:
Median = 15, Mean = 10
To find the Mode:
Mode=3×Median−2×Mean
Mode=3×15−2×10
Mode=45−20
Mode=25
Example 4: For a symmetrical distribution, the value of mean is 42. What can we say about the value of median and mode?
Solution:
For a symmetrical distribution, the value of mean, median and mode are approximately equal.
Hence,
Median = Mode = Mean = 42
Example 5: For a positively skewed distribution, the value of mean is 42 and mode is 20. What can we say about the value of median?
Solution:
For a positively skewed frequency distribution, the value of mean, median and mode has the following relation:
Mean > Median > Mode
For Mean = 42, and Mode = 20, we can say that the value of median lies in the range of 20 to 42.
Q1. Given: Mean = 24, Mode = 28. Calculate the Median and verify if the distribution is positively or negatively skewed.
Q2. Given: Mean = 40, Median = 35. Calculate the Mode and comment on the data distribution's symmetry.
Q3. Given: Mode = 48, Mean = 45. Calculate the Median and determine the implications for the data's central tendency.
Question: In a moderately skewed distribution, the median is 20 and the mean is 22.5. Using these values, find the approximate value of the mode.
Solution:
Given,
Mean = 22.5
Median = 20
Mode = x
Now, using the relationship between mean mode and median we get,
(Mean – Mode) = 3 (Mean – Median)
So,
22.5 – x = 3 (22.5 – 20)
22.5 – x = 7.5
∴ x = 15
So, Mode = 15.
Frequently Asked Questions – FAQs
Q1 What is the meaning of mean, median and mode?
For any given data, mean is the average of given data values and this can be calculated by dividing the sum of all data values by number of data values. Median is the middlemost value of the data set when data values are arranged either in ascending or descending order. Mode is the most frequently occurred data value.
Q2 What is empirical relationship between mean median and mode?
Empirical relationship between mean median and mode for a moderately skewed distribution can be given as:
Mean – Mode = 3 (Mean – Median)
Or
Mode = 3 Median – 2 Mean
Q3 What is the relation between mean median and mode for a frequency distribution with symmetrical frequency curve?
For a frequency distribution with symmetrical frequency curve, the relation between mean median and mode is given by:
Mean = Median = Mode
Q4 What is the relation between mean median and mode for a positively skewed frequency distribution?
For a positively skewed frequency distribution, the relation between mean median and mode is:
Mean > Median > Mode
Q5 What is the relation between mean median and mode for a negatively skewed frequency distribution?
For a negatively skewed frequency distribution, the relation between mean median and mode is:
Mean < Median < Mode
